Getting started
Few weeks ago, when I heard that the voting cards were available, I almost went into a frenzy. Not because I’m militing for a candidate. Sure, I have my opinions and convictions, but it’s not like I’m a fervent supporter of a given candidate, someone who sets out to convert anybody they get the chance to talk to about politics… Ok, maybe a little. But here, I was more driven by what voting means: a chance to speak up, an opportunity to make a difference or contribute to a change. And that’s something to take very seriously, a privilege that’s rarely acknowledged…well, until it’s taken away. Anyway…. I spent three days running, making calls, looking online to find out where I am registered to vote, where I could withdraw my card. After three days of weathering an impossibly burning sun and a freezing cold rain (brave me! - come one, I’m trying to turn this into a Hollywood movie material…or a Nollywood movie material), I finally got my card. I wanted to wait until the D-day to turn out and vote. That was it! But then, I learned through a friend that the electoral list was available online. And I saw an opportunity to do some data analysis. Rather than going out to conduct a poll - interesting ones are being done right now -, I thought I would focus on building a baseline, a foundation for the analysis of the results.
The data is available on the webpage of the General Delegation of Elections (Délégation Générale aux Elections). I specifically used the information from this document. It already has graphs, maps and tables.
The bulk of the work I did here consisted of organizing the data in an Excel spreadsheet, importing it into R and making it tidy. The output can be found on my Github page. Yes, I confirm it! The 80%/20% rule is true. Most of my data science time goes into organizing and cleaning the data. The remaining time, I use it to complain, drink a lot of coffee, and do some actual analysis.
Who are the voters?
On July 29, roughly 8 million Malian citizens are expected to vote. Well, at least, that how many people there are on the electoral list. Whether they will turn out or not is another story, one we will probably tell later.
What is known about the voters varies depending on the source one uses. For those doing polls, the information probably ranges from the age and sex to aspects like the marital status, the professional occupation, or even the number of pets the voters have. Unfortunately, with the electoral list, the information is not that rich. Which is not to say it’s not useful!
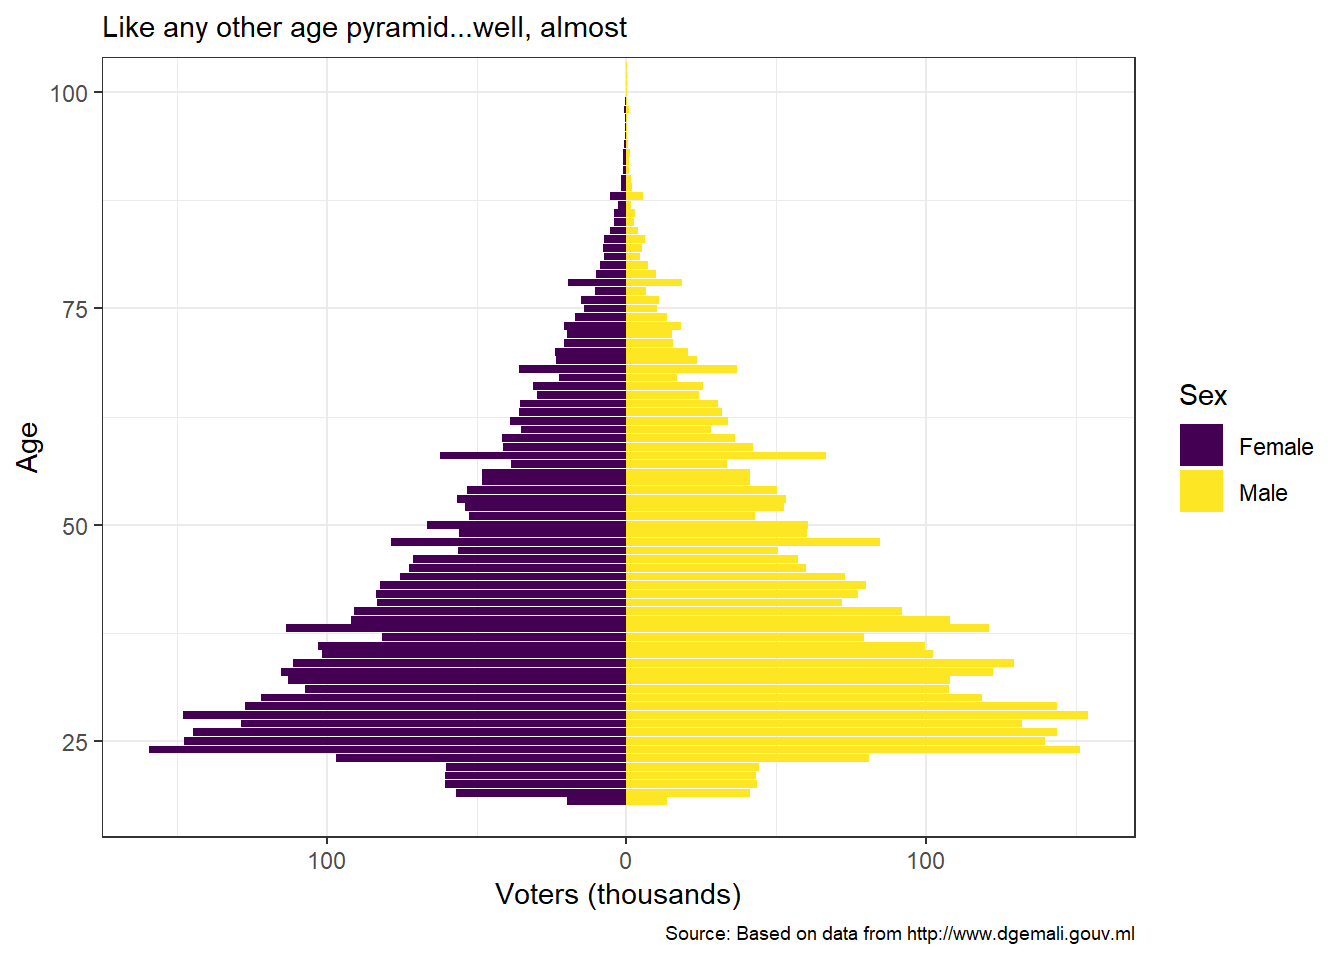
Here’s what we have: the voters’ age. Using the distinction by sex, we can visualize at least an age pyramid.
| Age group | Female | Male | Total |
|---|---|---|---|
| 18-25 | 16.11 | 14.32 | 15.24 |
| 26-35 | 29.67 | 32.39 | 30.99 |
| 36-45 | 21.38 | 22.13 | 21.75 |
| 46-55 | 14.43 | 14.20 | 14.32 |
| 56-65 | 9.91 | 9.48 | 9.70 |
| 65+ | 8.50 | 7.47 | 8.00 |
| Total | 100.00 | 100.00 | 100.00 |
As one would expect for a country like Mali, the age pyramid is an actual pyramid - sorry Japan, we need another name for you -, with a wide base. This means that the youth, those below 25 or 30 years of age are a key demographic group. However, I must admit that the base does not grow fully until the mid-20’s. That’s because, the youngsters are not all registered on the electoral list, which is derived from the biometric database of the register of births, marriages and deaths. To assess the gap, let’s compare with data from the 2009 census.
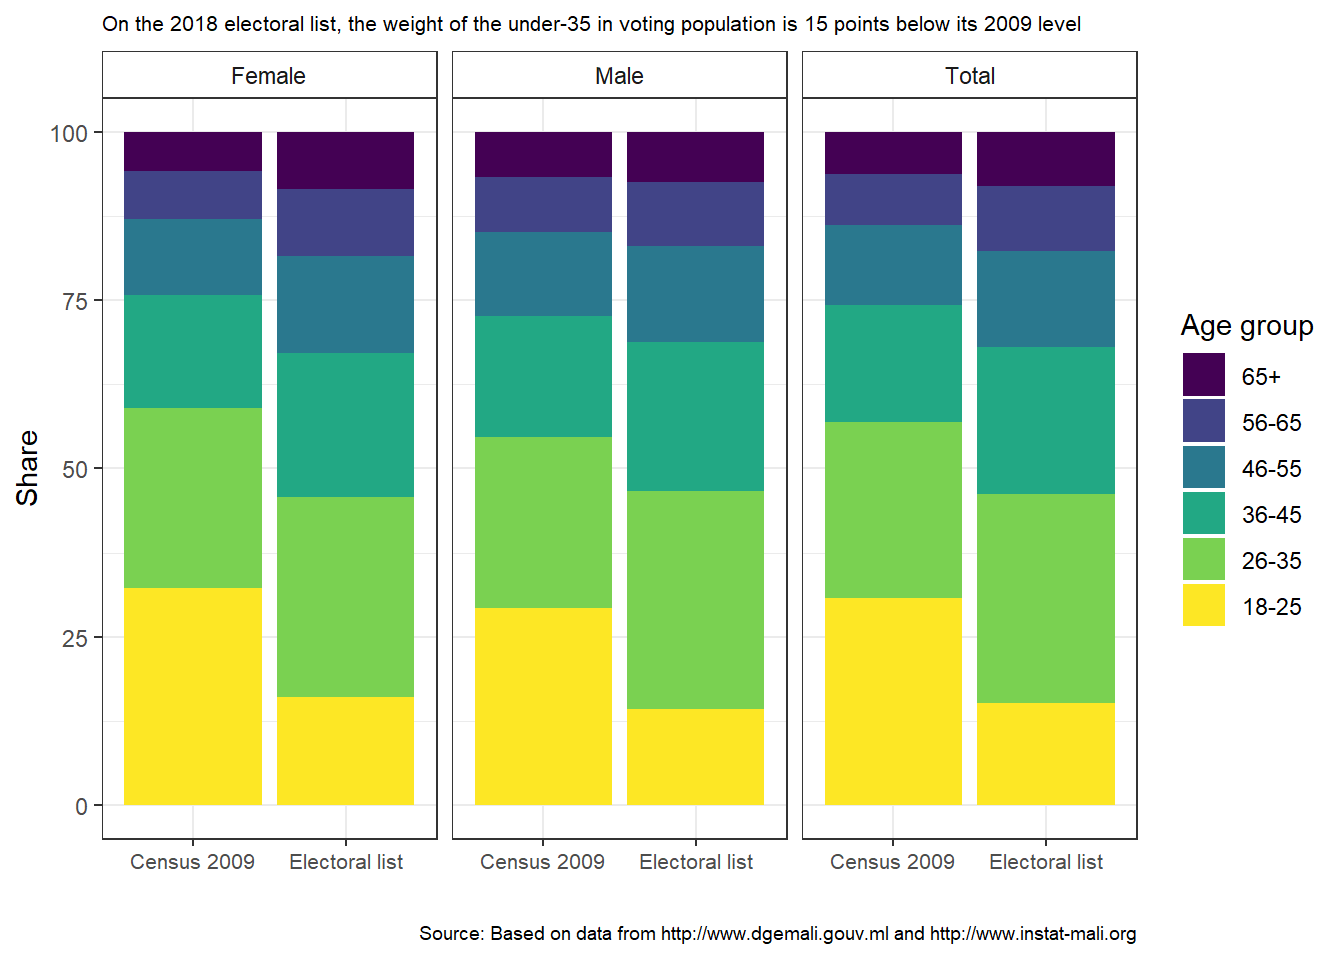
The comparison reveals that the weight of the population under 35 in the electoral list is 15 percentage points below its 2009 level (based on the 2009 census). We would have to wait and see if the youngsters that are registered will turn out and vote, and make up those who can’t.
Unfortunately, the DGE document does not cross the age of the voters with their location. That would’ve enabled additional visualization, such as the faceting of the age pyramid by region or by district.
Where are the voters?
When we turn to the voters’ location, we find more details in the document. Domestic voters are grouped by sex and by municipality, and those abroad by sex and by country.
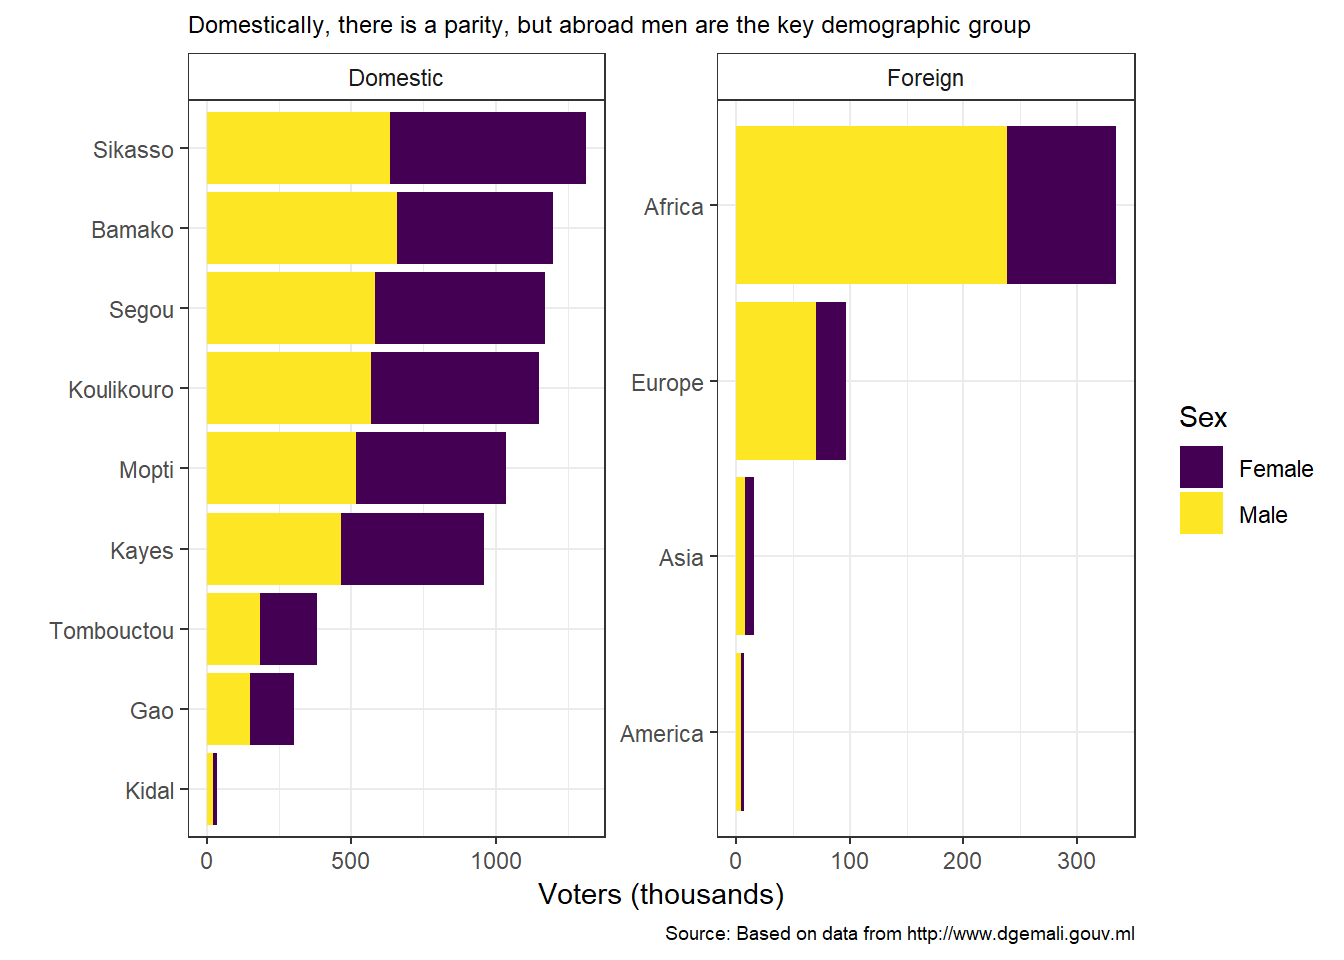
Domestically, voters are concentrated in the south of the country. The northern regions - Tombouctou, Gao, Kidal - represent 8.99% of the voting population. With the center added - Mopti -, that share goes up to 21.95%. These numbers are in line with the spatial distribution of the population. However, the extent to which the voting population will turn out in those regions is something independent of its size. It will depend on the security context. We will only be able to measure that afterwards.
When we turn to the voters located abroad - 452900 or 5.66% of the total voting population -, we clearly see the demographic of immigration at work. It is driven by men who, subsequently, constitute the majority of that group (70.82%).
| Zone | Region | Female | Male | Total |
|---|---|---|---|---|
| Domestic | Bamako | 13.81 | 16.07 | 14.97 |
| Domestic | Gao | 3.86 | 3.70 | 3.78 |
| Domestic | Kayes | 12.75 | 11.28 | 12.00 |
| Domestic | Kidal | 0.40 | 0.52 | 0.46 |
| Domestic | Koulikouro | 14.95 | 13.84 | 14.38 |
| Domestic | Mopti | 13.37 | 12.57 | 12.96 |
| Domestic | Segou | 15.06 | 14.20 | 14.62 |
| Domestic | Sikasso | 17.39 | 15.49 | 16.42 |
| Domestic | Tombouctou | 5.01 | 4.51 | 4.75 |
| Foreign | Africa | 2.46 | 5.80 | 4.17 |
| Foreign | America | 0.07 | 0.10 | 0.08 |
| Foreign | Asia | 0.20 | 0.20 | 0.20 |
| Foreign | Europe | 0.67 | 1.71 | 1.20 |
| Total | Total | 100.00 | 100.00 | 100.00 |
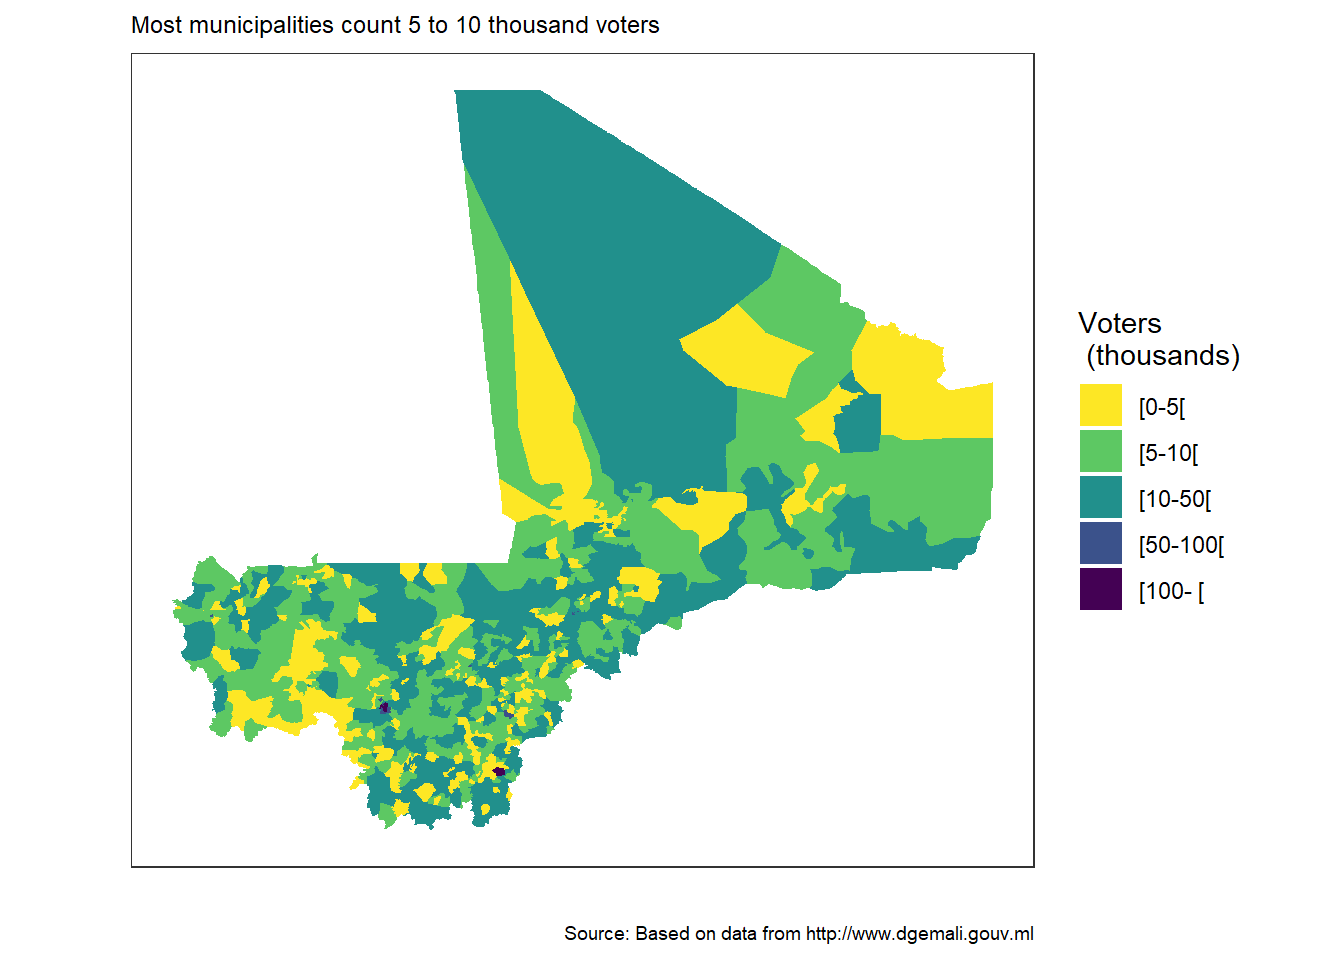
Now let’s go back to the homeland, and do some mapping to see how the electorate is scattered across the country. We start by grouping the municipalities by population size:
0 to 5 thousand ;
5 to 10 thousand ;
10 to 50 thousand ;
50 to 100 thousand ;
100 thousand and above.
| Voters (thousands) | Municipalities (number) | Municipalities (share, %) |
|---|---|---|
| [0-5[ | 236 | 33.57 |
| [5-10[ | 276 | 39.26 |
| [10-50[ | 178 | 25.32 |
| [50-100[ | 7 | 1.00 |
| [100- [ | 6 | 0.85 |
| Total | 703 | 100.00 |
We see that 72.87 of the municipalities count less than 10000 thousand voters. Now, we may not have the numbers to see how that factored into the campaign strategies. Did the candidates focus on the rural areas where reside the majority of the voters, but where the turn out rate might not be high? Or did they select the heavyweights, meaning the municipalities and districts of critical size, and where the mobilization can easily translate into votes? Given that we have a universal suffrage system, one can assume a reasonable trade-off on the candidates’ part. Let’s see which are the municipalities with the largest electorate. Let’s try 50 thousand voters and above:
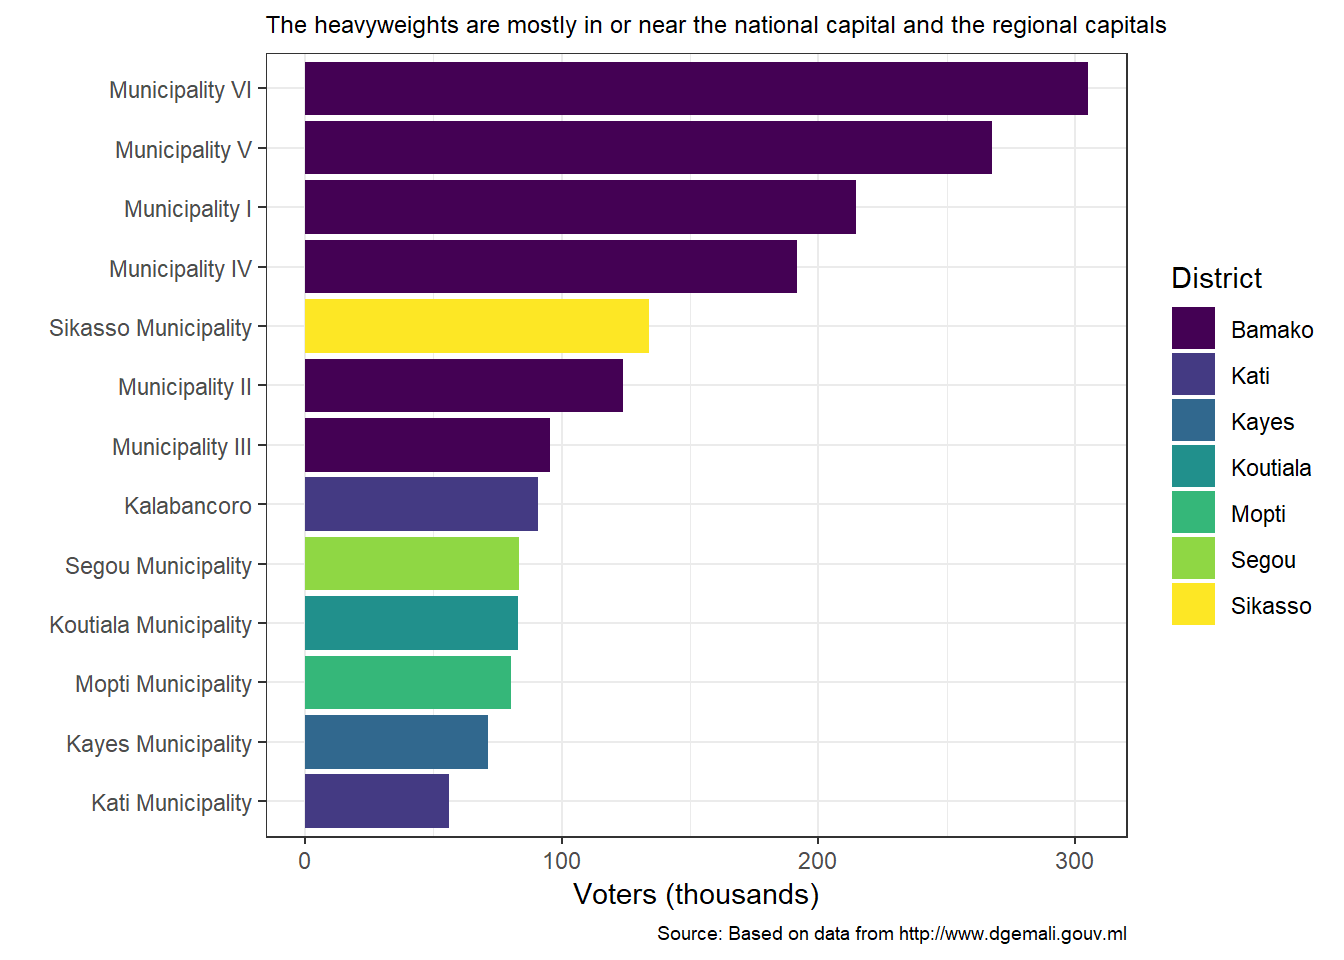
It clearly shows that they’re in the national capital or the regional capitals. The exceptions that make the list happen to be very close the capital (Kalabancoro, Kati) or to hold a strategic importance for the economy (Koutiala, for the cotton industry and the closeness to the border with Ivory Coast). The electorate in these heavyweights is 7 to 45 times larger than that of the median municipality (6564 voters). Therefore, it makes sense for a candidate to throw all they’ve got at them. We’ll see how it turns out. Hopefully, the results will be published in as much details as the list was given.
Few questions
As I examined the DGE document, few questions crossed my mind. The obvious one was - one that anyone who’s been aware of Mali’s situation over the last six years would probably ask - : “Can the elections really be held in this context?” Not only did I realize that the document did not have the data it takes to help me answer that question, but I also thought to myself that it was too late to raise it now that the decision has been made, and I myself I was determined to take part in it. However, it was still time to throw some questions around about the logistics.
“What can be learned by computing few statistics about the voters and the polling places?”
Let’s start by looking at the relationship between the number of voters and the number of polling places.
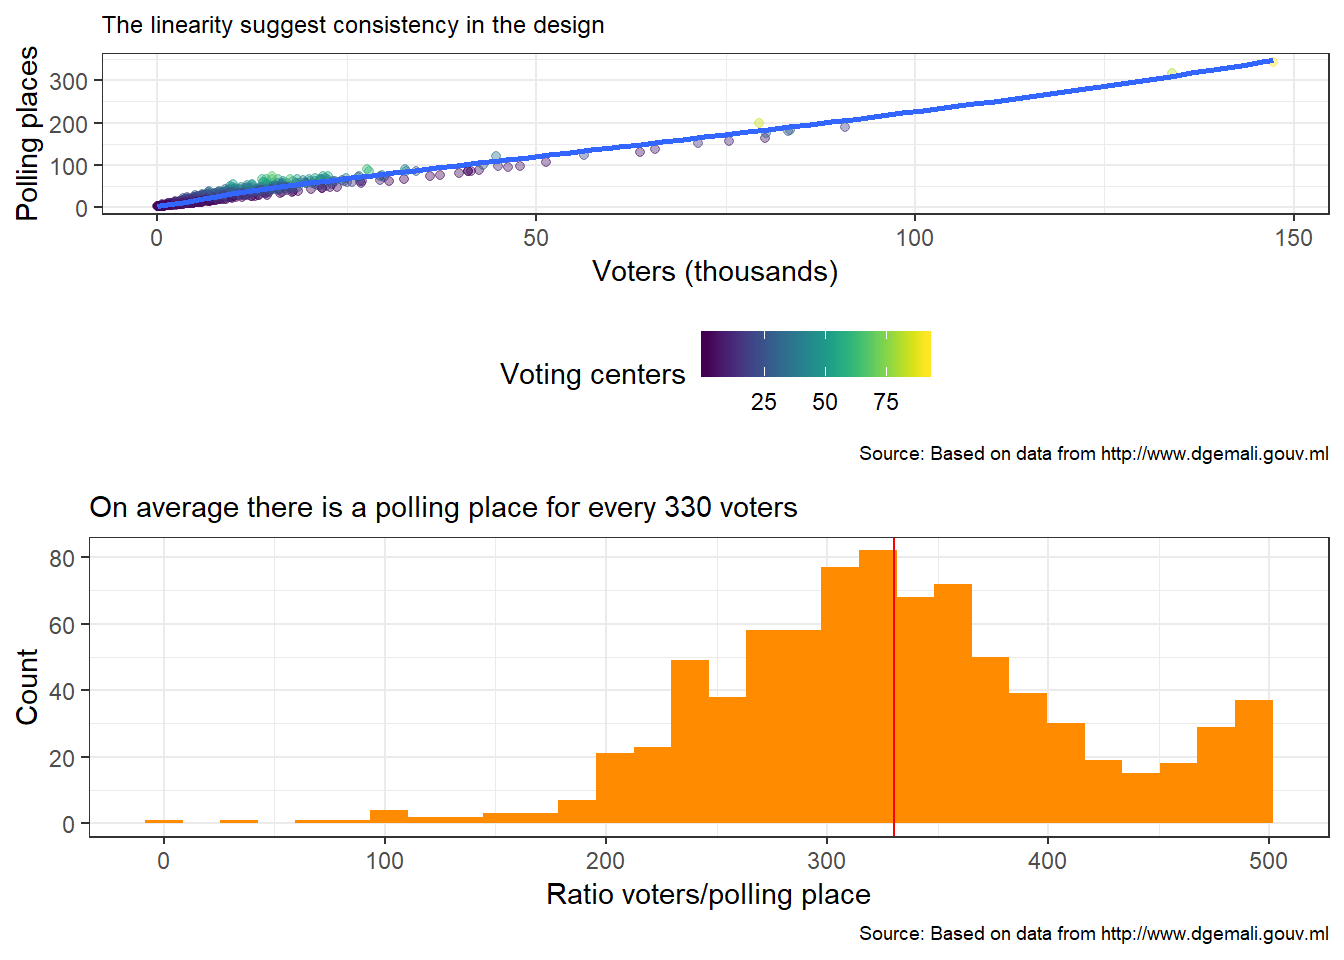
It appears that, on average, there is a polling place for every 330 voters. If the voting should take place during a 12-hour period for example, every vote should take about 2.18 minutes. Well, that’s based on the assumption of a full turn out. And also, 330 is just an average. Let’s map the ratio to see how the situation varies across the country.
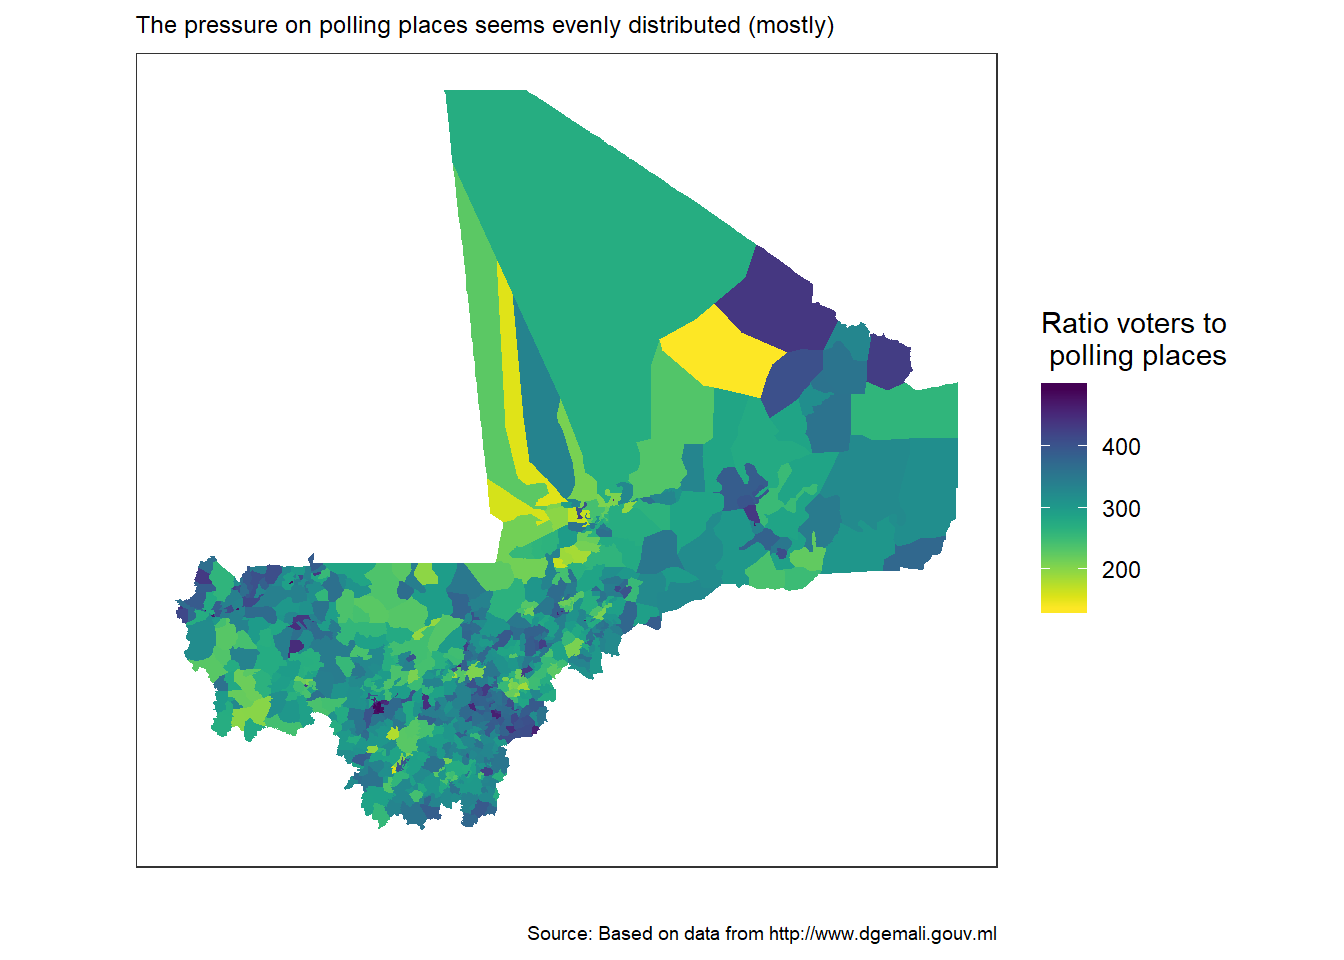
Overall, the pressure on the polling places seems evenly distributed across the country. With few exceptions in the north, though. The district of Goundam, in the north west has a low ratio. In Kidal we have extremes: a high-ratio municipality (Tessalit) next to a low-ratio one (Timtaghene).
It is also useful to remember that the polling places will be located in schools (called voting centers), where the number of classrooms can play a role in the pressure. Let’s see how the ratio polling places to schools is distributed across regions. Let’s compute the average ratio by region, along with the standard deviation (measuring the variability of the ratio across municipalities within the same region).
| Region | Mean | Standard deviation |
|---|---|---|
| Kayes | 1.88 | 1.30 |
| Koulikouro | 1.90 | 1.57 |
| Sikasso | 1.80 | 0.79 |
| Segou | 1.54 | 0.71 |
| Mopti | 1.63 | 1.09 |
| Tombouctou | 1.53 | 0.91 |
| Gao | 2.08 | 1.78 |
| Kidal | 1.44 | 0.60 |
| Bamako | 17.88 | 12.93 |
In the regions (outside the capital), the average ratio ranges from 1.5 to 2 (slightly above) across regions. There will be approximately two polling places per voting center. In Bamako the average is much higher, around 17, but so is the variability.
With the results, we’ll see how things turn out!
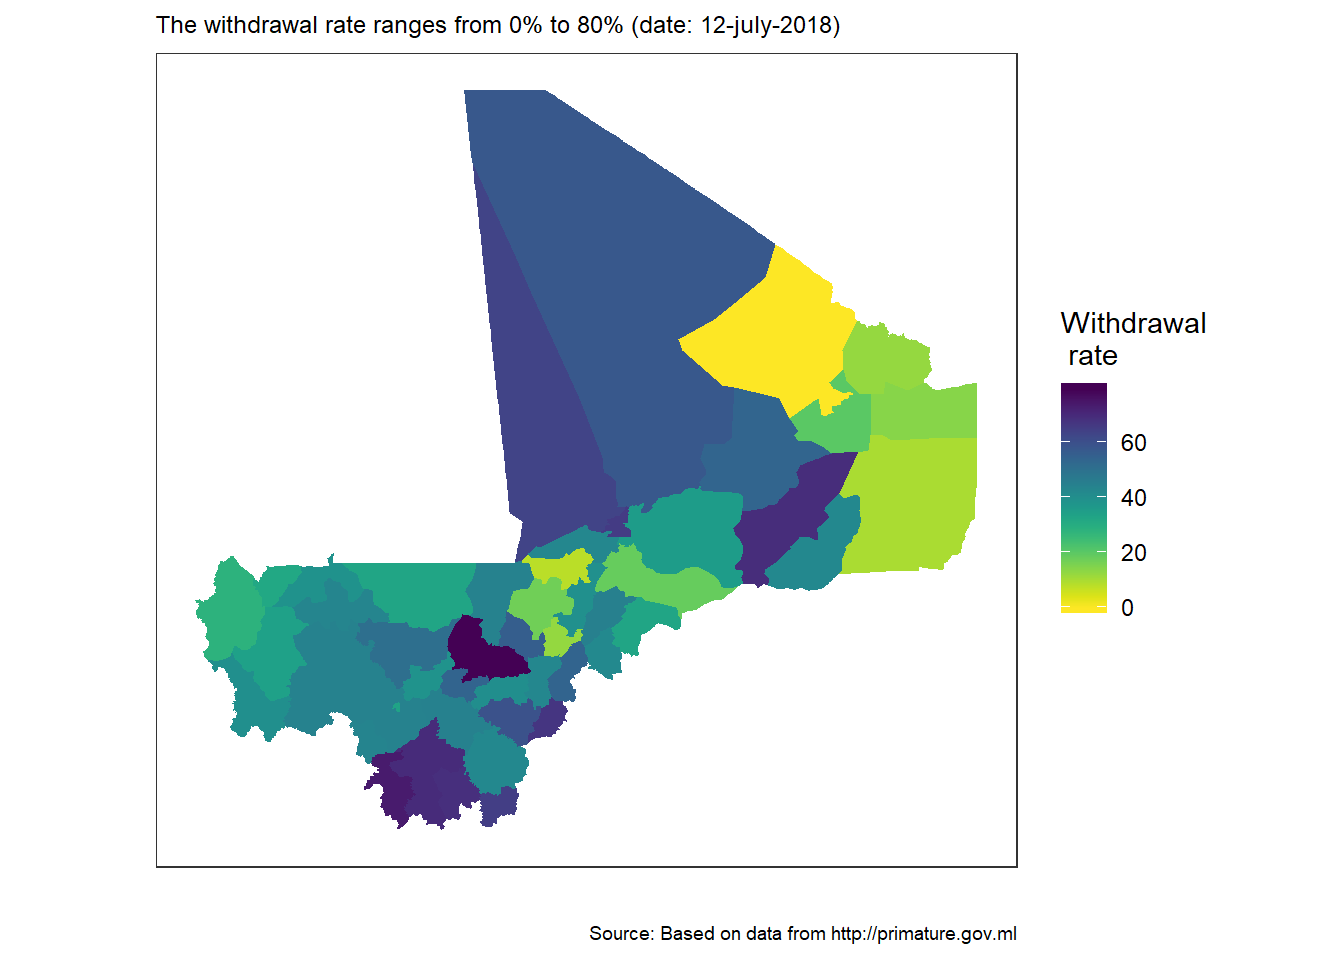
The withdrawal of electoral cards
On the website on the Prime Minister’s Office (Primature), announcements are made as to the number of voters who withdrew their electoral cards from the polls they are registered at. It seemed useful to examine those announcements and extract some data for visualization purposes, and also to consolidate the baseline for further analysis. The data used here comes from three pages: here, here, and here.
Are also added other sources from the online press and social networks (all relaying data from meetings with official sources). The details are given in this file.
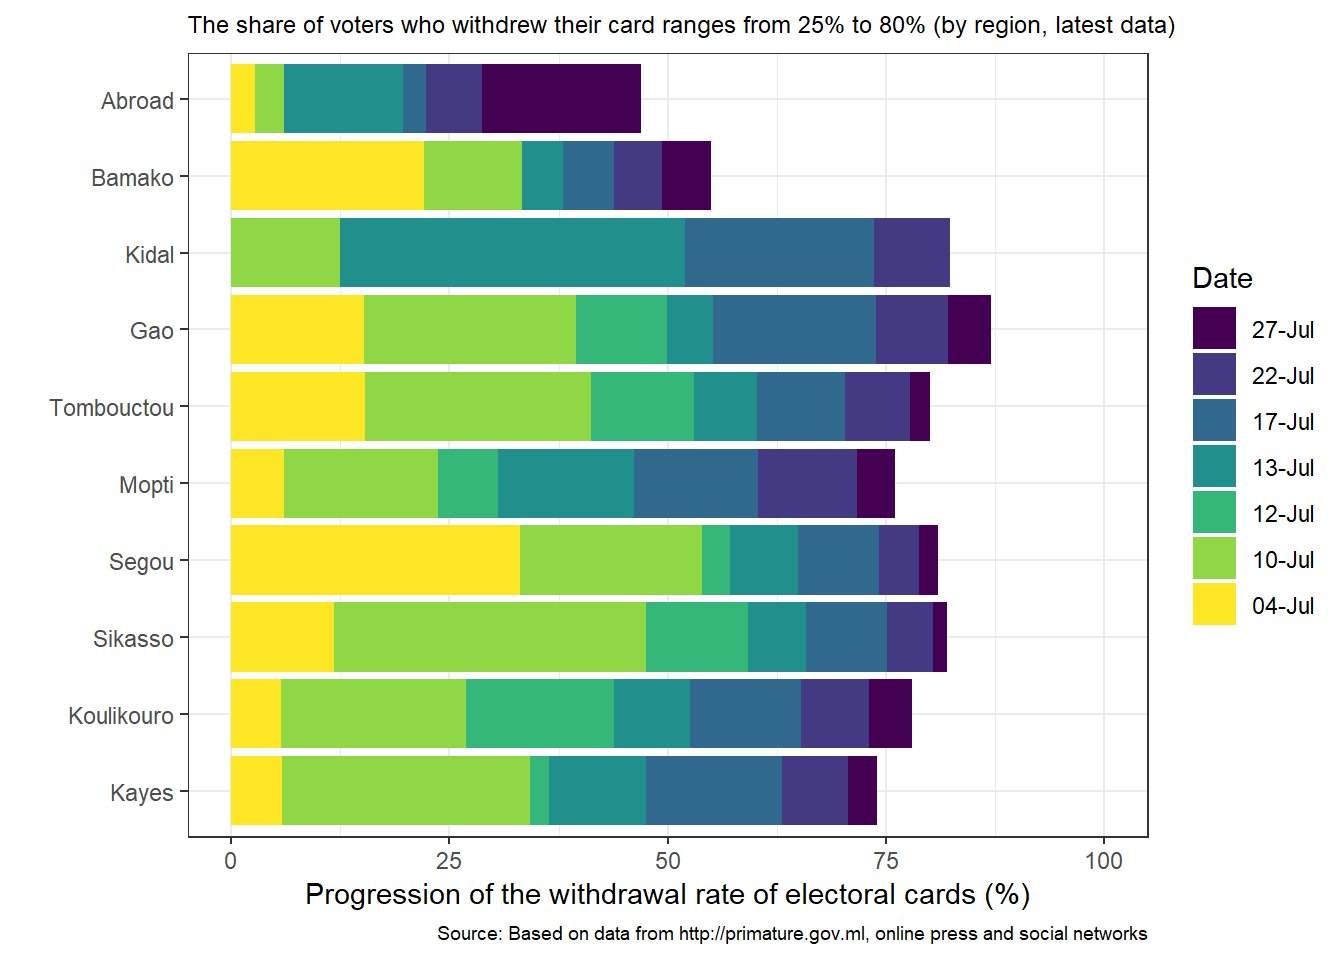
One of the pages gives details of the withdrawal data by district. Let’s map that!
Over the 45 centres listed, the rate is know for only 13. The information has not been given for the others.
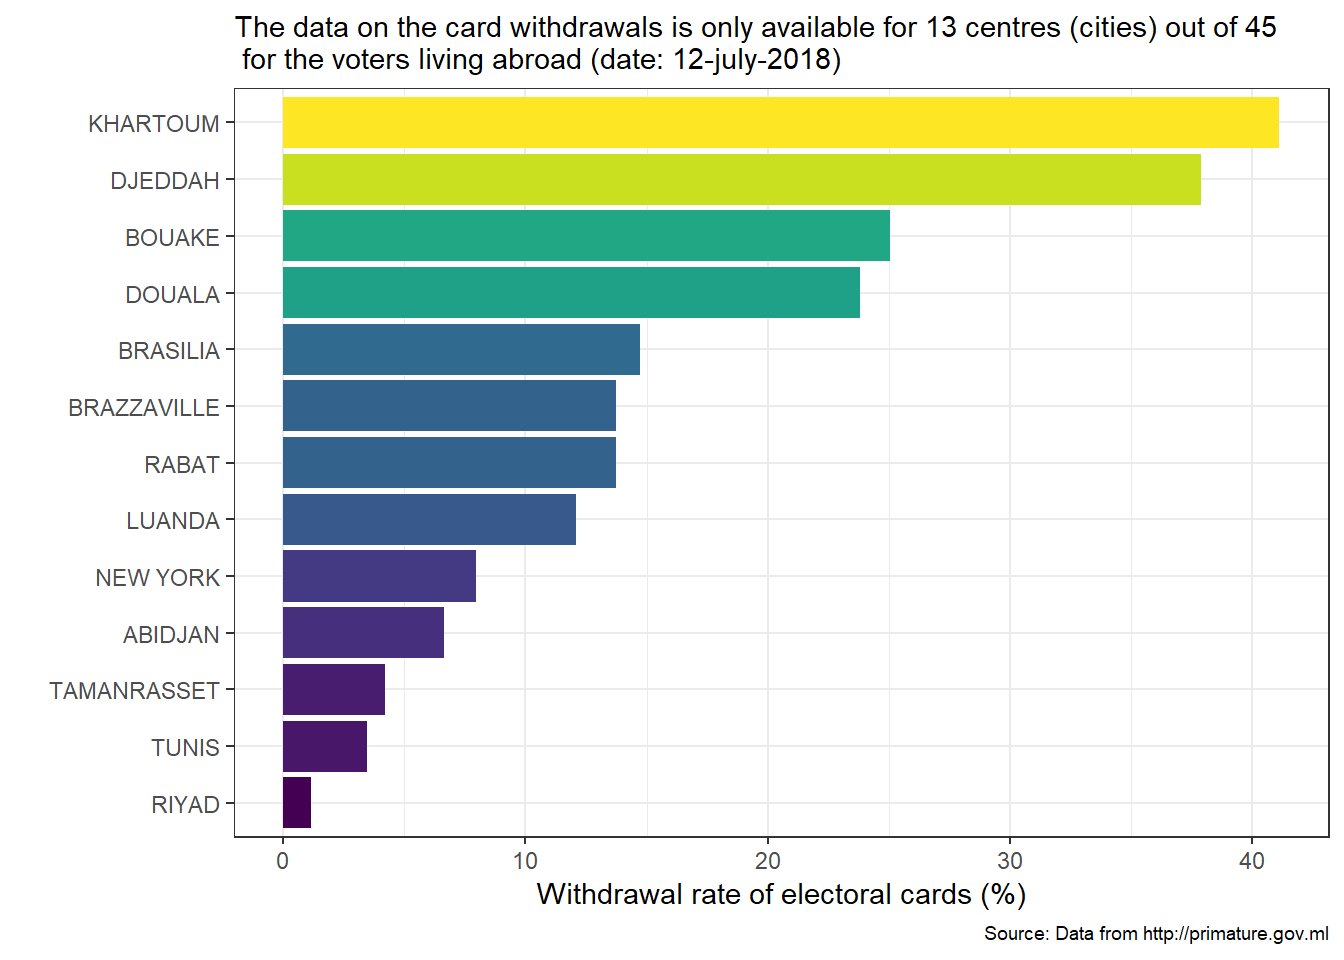 These centers represent about 51.61% of the electorate living abroad. However, the withdrawal is very low for the heavyweights of the list such as Abidjan (6.64% for about than 150 000 voters) or Bouaké (25.05% for over 30 000 voters).